The Orange Superfood
Full of Vitamin A
Good Source of Fiber
Good Source of Potassium
Complex Carbs
Roughly 100 Calories per Serving
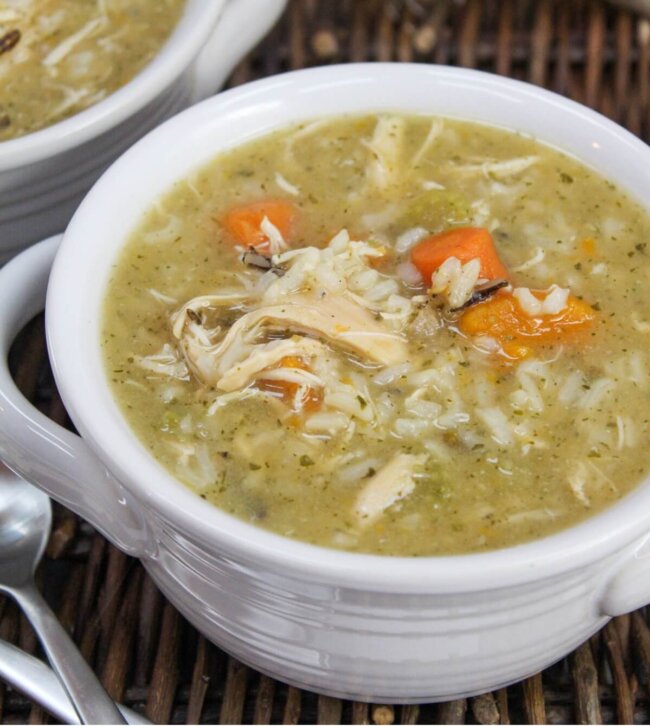
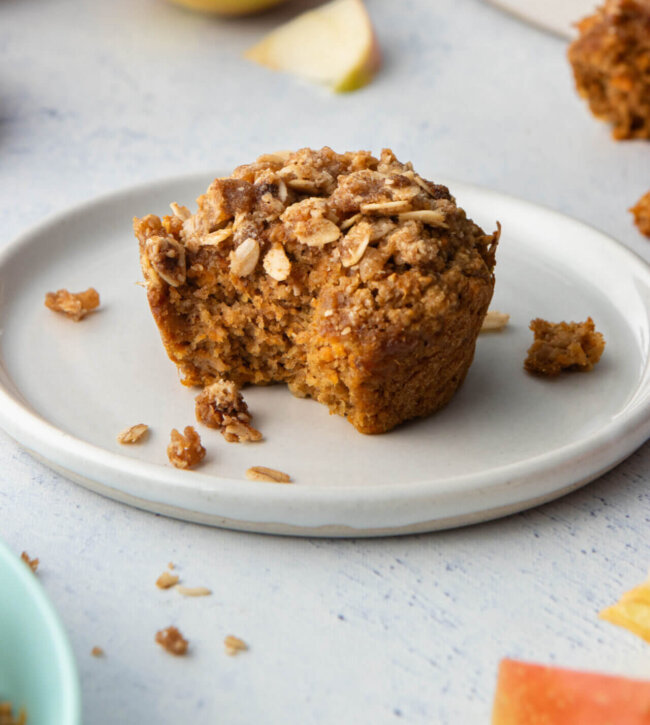
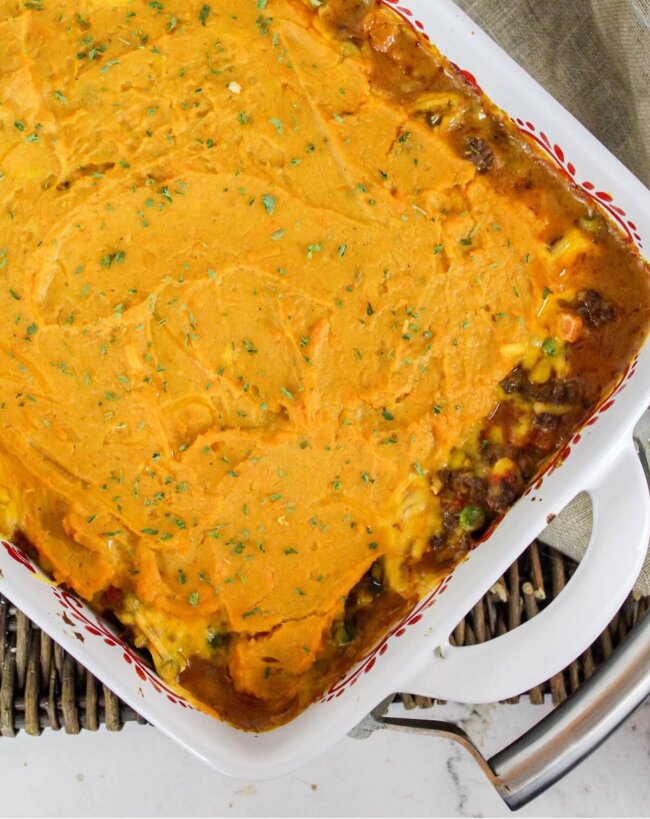
Winter Warm Ups
With winter upon us we encourage you to try one of the sweet recipes to warm you up!

A Community Around Sweetpotato
The North Carolina Sweetpotato Commission Inc. is a nonprofit corporation made up of over 400 sweetpotato growers along with the packers, processors and business associates that support them.